Snowflake's observability framework, which includes logging, tracing, and events, is a powerful toolkit for understanding and optimizing your data pipelines. It provides detailed insights into how your code interacts with data and how data flows through your applications.
This comprehensive system leverages the OpenTelemetry standard, a vendor-neutral approach to instrumenting, generating, collecting, and exporting telemetry data (logs, metrics, and traces) for analysis and visualization.
Telemetry Instrumentation Hierarchy
Logs: Capture discrete events within your Snowflake environment, providing a detailed, textual record of what happened at specific points in time. E.g.
logger.info(f"Processed {customer_count} customer records.")
logger.warning("High customer count detected.")
Traces: Record the flow of execution within your code, including timing and dependencies between operations. Traces are a sequence of events that belong to a single transaction.
Spans: A span is the basic unit of work in a trace. It represents a single operation within a trace and can have a parent-child relationship with other spans. In your code, you're creating spans using Snowflake's telemetry module: e.g.
telemetry.set_span_attribute("process_step", "fetch_order_details")
Trace Events: Trace events are discrete events that occur within a span. They provide additional context about what happened during the span's lifetime. In your code, you're adding events to spans: e.g.
telemetry.add_event("order_processed", {"order_id": order_id, "status": "SUCCESS"})
Attributes: Attributes are key-value pairs that provide additional context to spans or logs. They help in filtering and analyzing telemetry data: e.g.
telemetry.set_span_attribute("order_id", order_id)
Events: Structured data points emitted by your code, providing context and additional details about logs and traces.
Snowflake Trail
SnowTrail is Snowflake's observability framework that provides detailed logging and tracing capabilities. It's the umbrella of features designed to help users understand and optimize query performance, troubleshoot issues, and gain insights into their Snowflake usage.
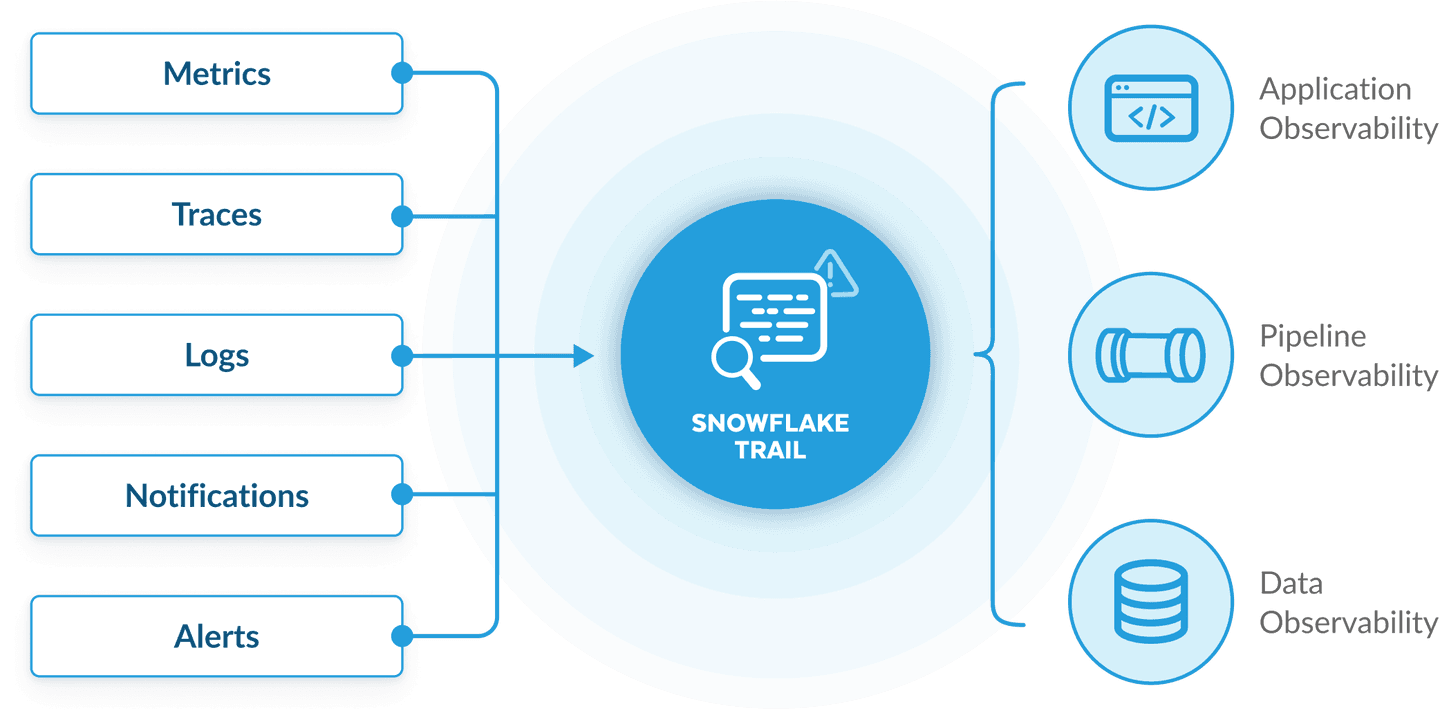
This includes native APIs for Python, Java, JavaScript, Scala, and Snowflake Scripting to emit, capture and analyze telemetry data in snowflake.
Practical Example:
Let’s illustrate the power of SnowTrail and observability using a real-world example from the OrdersDB data model (setup the model in your practice environment if you haven’t done so already).
Next, before we dive into the code, let's set up the necessary components:
-- Create a dedicated database for observability
CREATE OR REPLACE DATABASE observability_db;

-- Create an event table to store logs and traces
CREATE OR REPLACE EVENT TABLE observability_db.public.observability_event_table;

-- Associate the event table with your account (requires ACCOUNTADMIN role)
ALTER ACCOUNT SET EVENT_TABLE = observability_db.public.observability_event_table;

-- Set log level to INFO
ALTER SESSION SET LOG_LEVEL = INFO;

-- Enable Tracing
ALTER SESSION SET TRACE_LEVEL = ALWAYS;
Important Note: The Event Table created above is a special type of table designed to store logging and tracing data generated within your Snowflake environment. It has a predefined set of columns to capture various information, such as timestamps, event types, log messages, and trace details. By associating an event table with your Snowflake account, you can collect and centrally store all logs and traces, making it easier to analyze, troubleshoot, and monitor the health and performance of your data pipelines and applications.
Logging Customer Counts
This Python UDF logs a message indicating the number of customer records processed:
-- Create a Snowpark Python function to log customer counts
CREATE OR REPLACE FUNCTION log_customer_counts()
RETURNS VARCHAR
LANGUAGE PYTHON
RUNTIME_VERSION = 3.8
HANDLER = 'run'
AS $$
import logging
import random

# Create a logger instance with a specific name
logger = logging.getLogger("salesdb.custs.customer_processing_logger")

def run():
    # Simulate processing customer records
    customer_count = random.randint(10, 100)
    logger.info(f"Processed {customer_count} customer records.")

    # Simulate different logging scenarios
    if customer_count > 50:
        logger.warning("High customer count detected.")
    elif customer_count < 20:
        logger.debug("Low customer count.")
    else:
        logger.info("Normal customer count.")
    if customer_count == 0:
        logger.error("No customers found!")

    return "SUCCESS"
$$;
To execute it:
select log_customer_counts();
Querying Logs
You can query the event table to retrieve the logged messages:
-- Query for all types of events in the event table
select * from observability_db.public.observability_event_table;

-- Query specifically for logs and extract relevant information
SELECT
    TIMESTAMP AS time,
    RESOURCE_ATTRIBUTES['snow.executable.name'] as executable,
    RECORD['severity_text'] AS severity,
    VALUE AS message
FROM
    observability_db.public.observability_event_table
WHERE
    RECORD_TYPE = 'LOG';
Sample results:
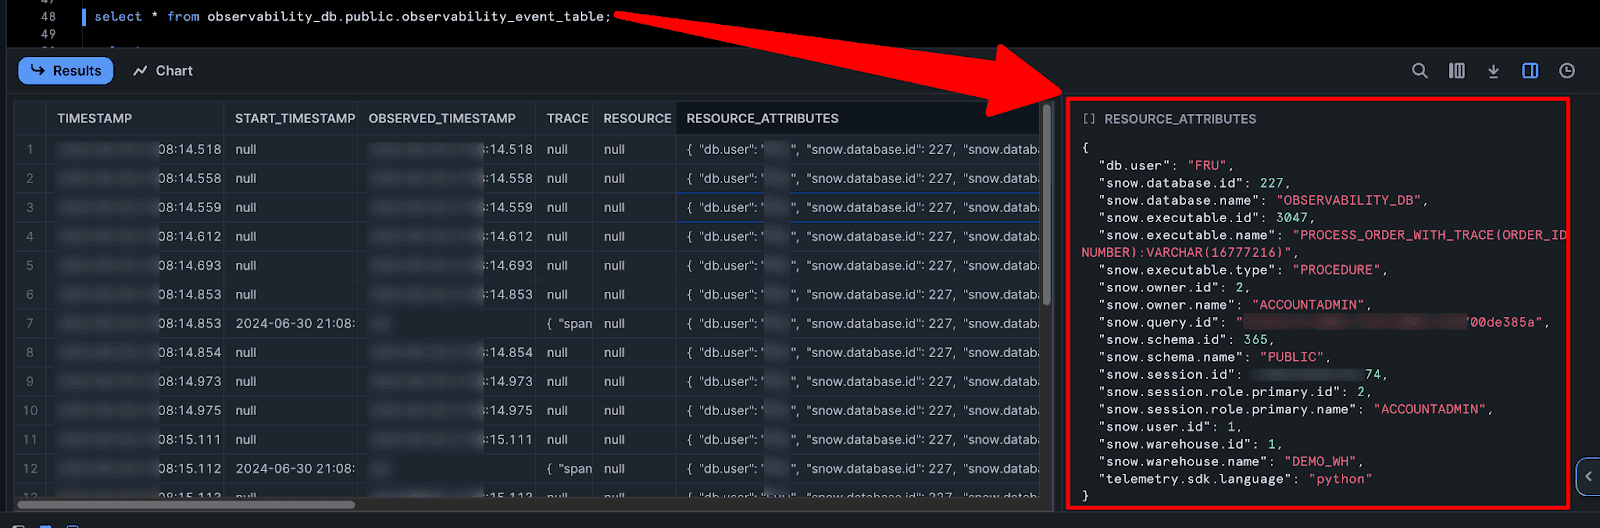
Tracing the process_order_with_trace Procedure
Let's create and use a process_order_with_trace stored procedure to demonstrate tracing.
CREATE OR REPLACE PROCEDURE observability_db.public.process_order_with_trace(order_id INT)
RETURNS VARCHAR
LANGUAGE PYTHON
RUNTIME_VERSION = '3.8'
PACKAGES = ('snowflake-snowpark-python', 'snowflake-telemetry-python')
HANDLER = 'process_order_with_trace'
AS $$
import snowflake.snowpark as snowpark
from snowflake.snowpark import Session
from snowflake.snowpark.functions import col, sum
from snowflake import telemetry
import json

def process_order_with_trace(session: Session, order_id: int):
    #Fully qualify the table names within the SP
    sales_order_table = "OrdersDB.public.sales_order"
    customer_table = "OrdersDB.public.customer"
    sales_order_item_table = "OrdersDB.public.sales_order_item"
    observability_event_table = "observability_db.public.observability_event_table"
    # Add order_id as a span attribute
    telemetry.set_span_attribute("order_id", order_id)

    # Fetch order details
    telemetry.set_span_attribute("process_step", "fetch_order_details")
    order_df = session.table(sales_order_table).where(f"order_id = {order_id}")
    order_list = order_df.collect() #Collect results from order_df

    # If order doesn't exist, log an event and return
    if len(order_list) == 0: #Check if the query returned results
        telemetry.add_event("order_not_found", {"order_id": order_id})
        return "Order not found."

    order = order_list[0] #Extract the first row as dictionary


    # Fetch customer details
    telemetry.set_span_attribute("process_step", "fetch_customer_details")
    customer_id = order["CUSTOMER_ID"]
    customer_df = session.table(customer_table).where(f"customer_id = {customer_id}")
    customer = customer_df.collect()[0] if customer_df.count() > 0 else None
    telemetry.add_event("fetch_customer_details", {"order_id": order_id, "status": "SUCCESS"})

    # Calculate total using snowpark functions. Do not iterate over the columns
    telemetry.set_span_attribute("process_step", "calculate_total")
    order_price = order_df.select(sum(c
-
ol("order_price").cast("float")).alias("order_price")).collect()[0]["ORDER_PRICE"]
    telemetry.set_span_attribute("order_price", order_price)
    telemetry.add_event("calculate_price", {"order_id": order_id, "status": "SUCCESS"})

    # Update order status
    telemetry.set_span_attribute("process_step", "update_order_status")
    # Create a dictionary with the new order status
    updated_order = {"ORDER_ID": order["ORDER_ID"], "ORDER_STATUS": 'Shipped'}
    # Update the sales_order table directly
    session.table(sales_order_table).filter(col("ORDER_ID") == order_id).update(updated_order)
    telemetry.add_event("updated_order_status", {"order_id": order_id, "status": "SUCCESS"})

    # Order processed successfully
    telemetry.add_event("order_processed", {"order_id": order_id, "status": "SUCCESS"})


    # Log the high-value order information (convert numeric values to strings)
    log_message = f"High-value order placed: Order ID={str(order['ORDER_ID'])}, Customer ID={str(order['CUSTOMER_ID'])}, Total Amount={str(order_price)}"  # Use order_price here


    return "Order processed successfully."
$$;
To execute it:
CALL process_order_with_trace(5400003);
The CALL process_order_with_trace(5400003); statement triggers the stored procedure for a specific sales order (ID 5400003). This procedure not only processes the order by fetching details, checking inventory, calculating the total, and updating the status, but also incorporates tracing using Snowflake's telemetry framework.
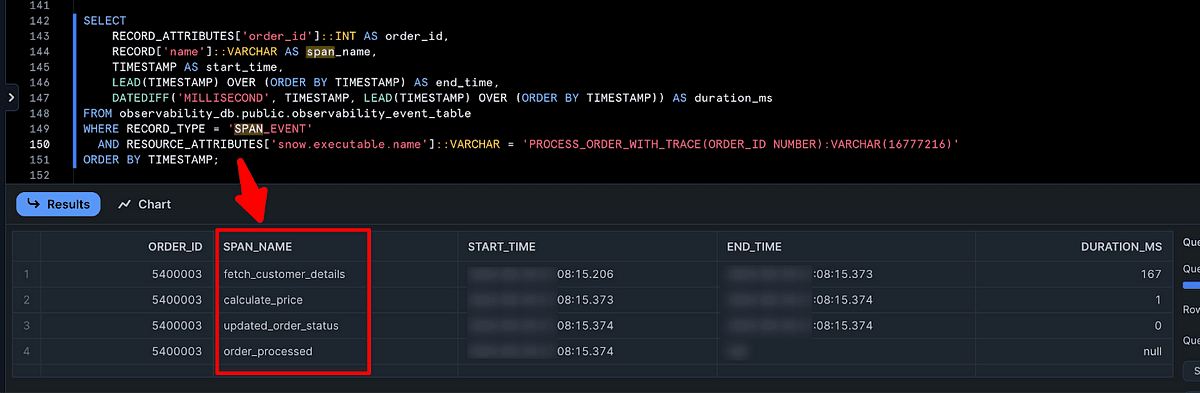
Query for Traces and Span Events:
SQL
-- Query for all types of events in the event table
select * from observability_db.public.observability_event_table;

-- Query for Span Events
SELECT
    RECORD_ATTRIBUTES['order_id']::INT AS order_id,
    RECORD['name']::VARCHAR AS span_name,
    TIMESTAMP AS start_time,
    LEAD(TIMESTAMP) OVER (ORDER BY TIMESTAMP) AS end_time,
    DATEDIFF('MILLISECOND', TIMESTAMP, LEAD(TIMESTAMP) OVER (ORDER BY TIMESTAMP)) AS duration_ms
FROM observability_db.public.observability_event_table
WHERE RECORD_TYPE = 'SPAN_EVENT'
  AND RESOURCE_ATTRIBUTES['snow.executable.name']::VARCHAR = 'PROCESS_ORDER_WITH_TRACE(ORDER_ID NUMBER):VARCHAR(16777216)'
ORDER BY TIMESTAMP;
Results:
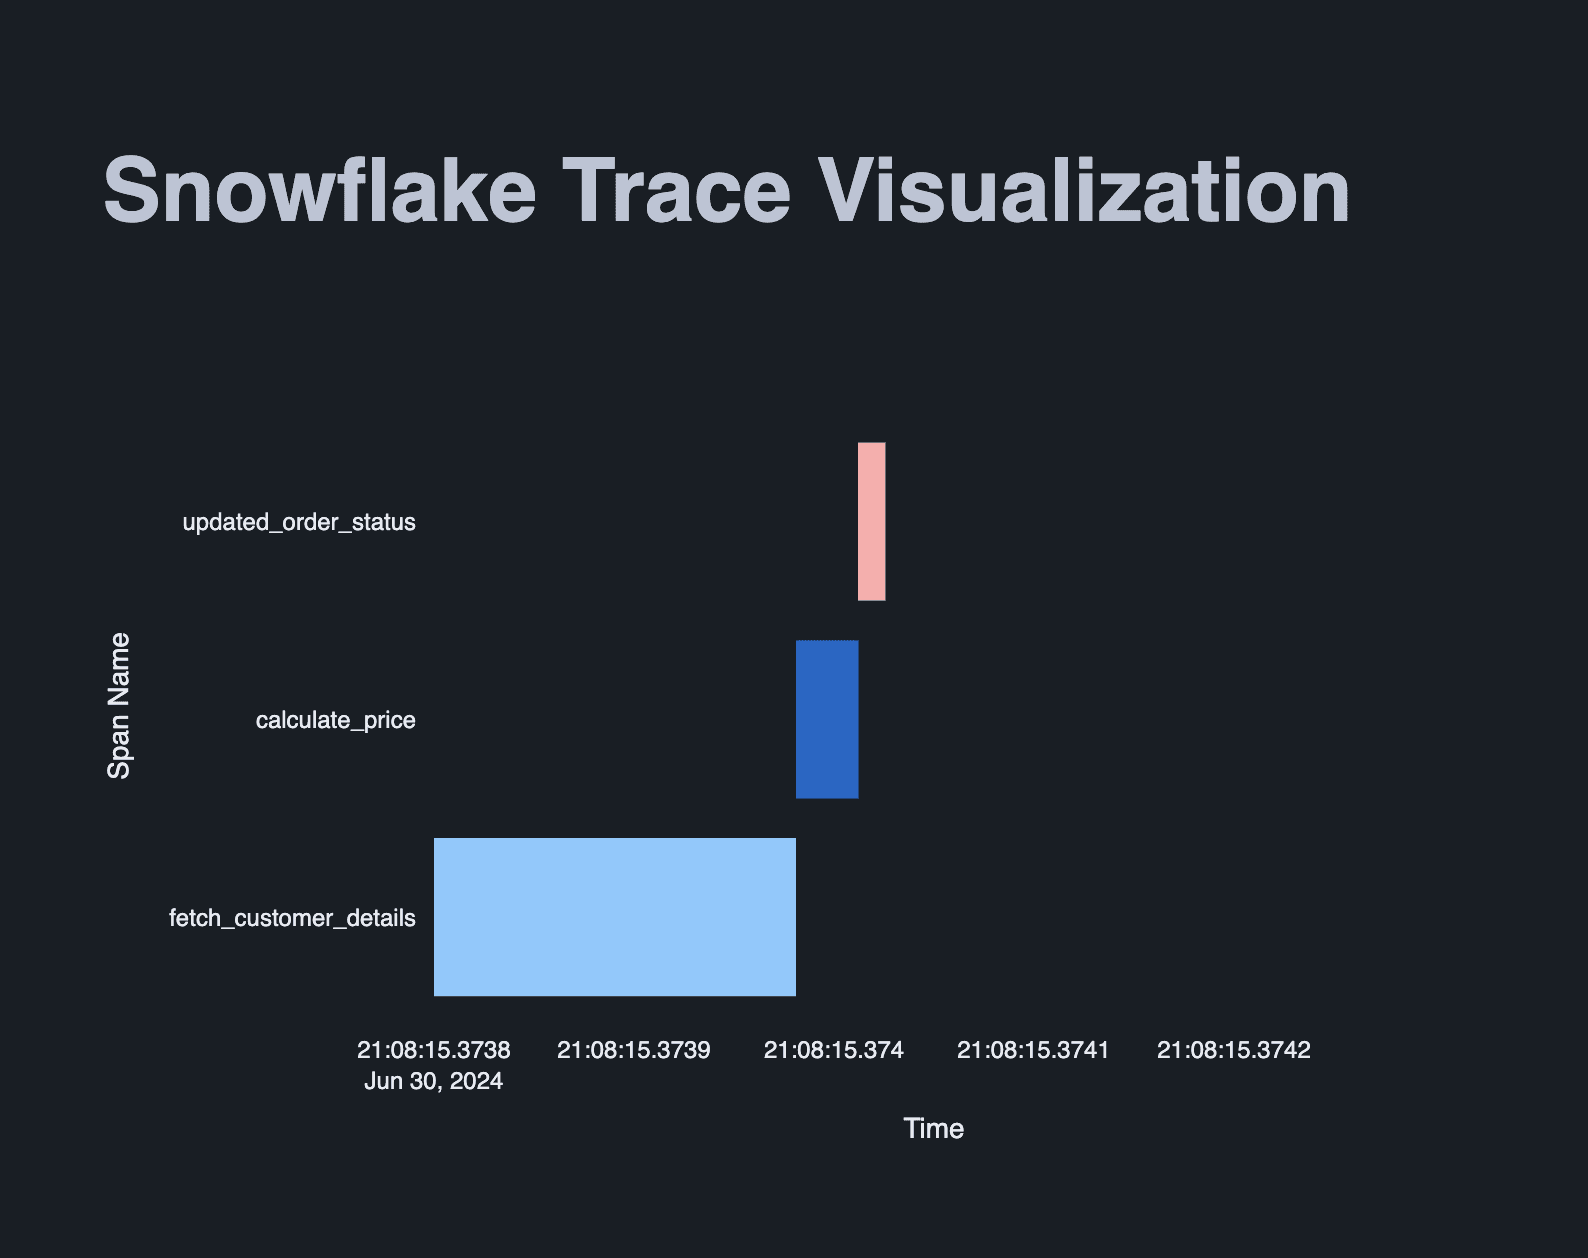
Using a simple streamlit app (code not included in this tutorial) to visualize the order flow through the stages:
Conclustion & Resources
As we've seen, Snowflake's observability framework—comprising logging, tracing, and events—is a powerful toolkit for understanding and optimizing your data pipelines. By leveraging these capabilities, you can gain deep insights into how your code interacts with data, identify performance bottlenecks, and proactively detect and resolve issues. This level of observability is essential for building reliable, efficient, and scalable data applications.
To delve further into Snowflake observability and explore advanced techniques, be sure to check out these additional resources:
Additionally, consider exploring third-party observability platforms like DataDog and Metaplane, which offer seamless integration with Snowflake and provide additional features for monitoring, alerting, and visualization.


